CommentaryFood Delivery
One of the prime drivers behind investment in alternative proteins is that conventional agriculture has a huge impact on climate emissions. But putting a precise number on that impact is a contested exercise and as a recent report shows, the estimates for impact can vary enormously depending on what you include in the data sets.
If you haven’t already, I heartily recommend checking out the fantastic Our World in Data website, which is on a mission to popularise a nuanced understanding of world data and progress in key technologies. Its work on the collapsing cost of
solar for instance is brilliant but earlier this year, the website and its authors have started to dig a little deeper into the data surrounding the environmental footprint, especially in carbon emissions, of ‘conventional’ agriculture.
First though, a bit of background. There’s been a fairly feverish debate around the data on this footprint with many lobbies in the conventional ag space pushing back on recent studies showing a big impact. In the UK for instance the NFU, the National Farmers Union, has been pushing back on the ‘all farming is bad’ point of view and if you want an intelligent primer on their views check out the NFUs dedicated climate change sub section on their website :
https://www.nfuonline.com/news/latest-news/achieving-net-zero-meeting-the-climate-change-challenge/. What I think is fair to say is that firstly it’s a two way street, namely that though there are some obvious negative impacts, simply seeing farms impact on CO2 emissions and missing all the other environmental work farmers do, is something of an own goal. Also farms will need to be part of the solution and areas such as carbon sequestration are a huge potential new market for farmers.
But the impact of farming, especially modern factory scale operations, is undeniable. The challenge is measuring that impact. Which brings us back to the World in Data folks. Rather than selectively quote form just one research led data source, they’ve compared the likely impact using two different studies. You can see the original article here:
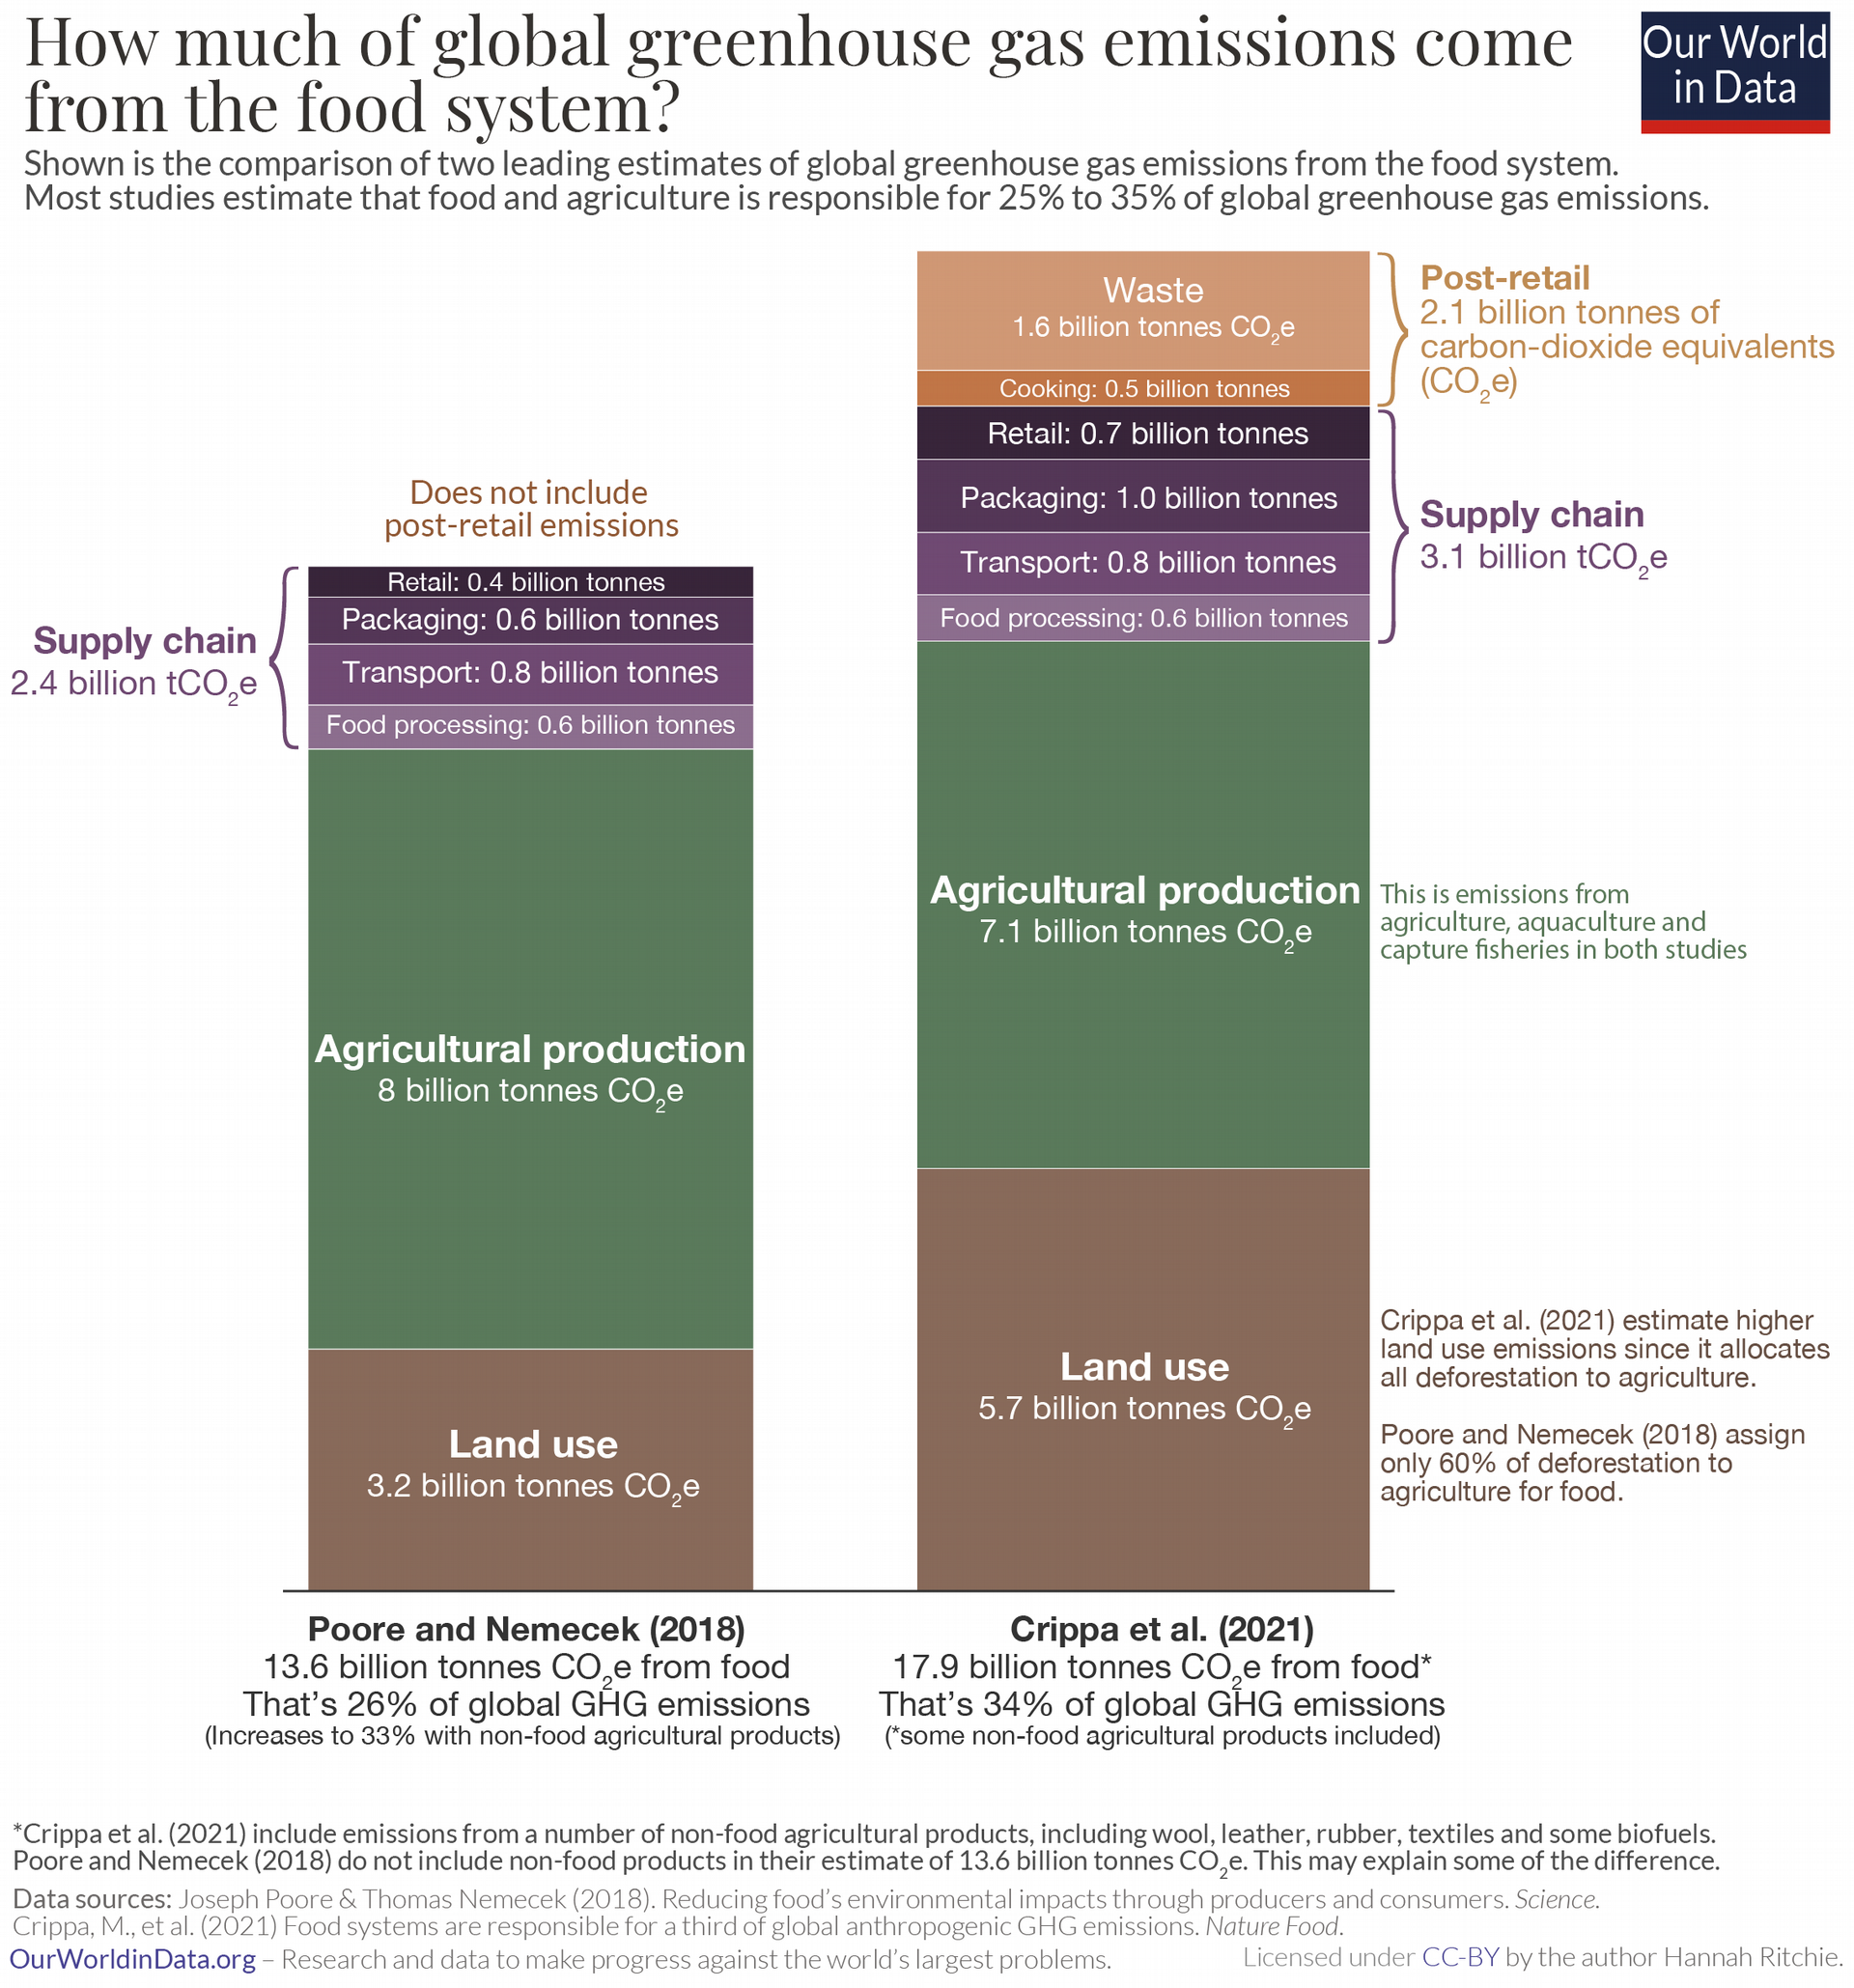
https://ourworldindata.org/greenhouse-gas-emissions-foodThe starting point for any aggregate analysis is the Intergovernmental Panel on Climate Change (IPCC) Special Report on Climate Change and Land which suggests a range from 10.8 and 19.1 billion tonnes of CO2-equivalent (CO2e) emissions per year. As the website observes that’s quite a big difference between the upper and lower range. Cue two recent papers which provide more granular data : Poore and Nemecek (2018) and Crippa et al. (2021). Any aggregate, global analysis has to deal with emissions from a wide chain of processes including land use itself (and including deforestation), agricultural production, the supply chain and post retail (refrigeration and food waste).
“Poore and Nemecek, shown on the left, estimated that food was responsible for 13.6 billion tonnes of CO2e. Crippa et al. estimate 17.9 billion tonnes of CO2e. So, there’s a difference of around 4 billion tonnes. Where does it come from?
-
Consumer cooking and waste are not always included in Poore and Nemecek: the easiest differrence to spot is that Poore and Nemecek only quantify emissions up to the retail stage of the supply chain. They don’t include energy use by consumers or consumer waste. As we see from the chart, this amounts to 2.1 billion tonnes CO2e.
-
Land use emission estimates differ: the biggest difference is in land use emissions. Crippa et al. (2021) estimate emissions to be 2.5 billion tonnes CO2e higher. This can be largely explained by differences in the attribution of deforestation. They allocate all of global deforestation to agriculture. However, the authors note that this is a main limitation of their approach, since only around 80% of deforestation is driven by agricultural expansion (the rest driven by urban development, mining and other human land use change). So their deforestation estimate is possibly a bit too high. Poore and Nemecek only allocated 60% of deforestation to food systems. This might be a bit of an underestimate. Land use emissions due to agriculture are likely to be somewhere in the middle of these two values.
-
Food vs. non-food agricultural products: the other main difference is that Poore and Nemecek only include food products in their 13.6 billion tonnes CO2e figure. Non-food agricultural products such as cotton, wool, leather, rubber, and biofuels are not included. They do also provide a separate estimate which includes non-food products; this estimates that agricultural products as a whole contribute 33% to global emissions. Crippa et al. (2021) do include at least some of these non-food agricultural products in their estimate.
-
Comparing these two studies is useful because they highlight the main differences we see across the range of studies on food emissions. The big differences are: what stages of the supply chain are covered (some studies include consumer cooking and waste, some don’t); whether non-food agricultural products such as biofuels and textiles are included; and the biggest uncertainty is emissions from deforestation and land-use change. The uncertainty in deforestation emissions estimates from the UN FAO can be as high as 50%, and over 100% for emissions from peatlands.4 Deforestation can also vary a lot from year-to-year, so decadal average values are often used.
The World in Data suggests that a sensible range is between “25% to 30% from food…[and] one-third if we include all agricultural products.” My own analysis would be slightly more cautious and I would be closer to 20% after allowing for some probability based confidence levels.